A network of the types of crimes in San Francisco, CA
Relationships between different types of crimes can be visualized as a network, with a node representing each type of crime (e.g., bribery, stolen property, or drug-dealing) and a link quantifying the co-occurrence of two types of criminal activities in the same neighborhood (within a time window). This notebook illustrates the relationships between various types of crimes in San Francisco, CA (data available at https://data.sfgov.org). Two types of crimes are related if most instances associated to both types happened in the same neighborhood within the same day.
The video below highlights the types of crime with the two highest eigenvector centralities, which correspond to nodes that are connected to many other well-connected nodes.
The video below highlights the types of crime with the two highest eccentricity centralities, which corresponds to the nodes that are at short maximum distances to every other node.
The video below highlights the types of crime with the two highest degree centralities, which corresponds to the nodes that have high vertex degrees.
The video below highlights the types of crime with the two highest betweenness centralities, which corresponds to the nodes that are on many shortest paths of other node pairs.
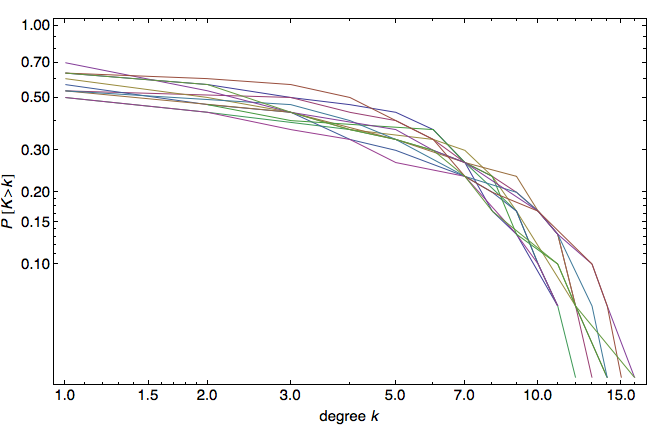
Next, the plots below show the degree distribution (for different days) during a 90-day period. Simulations are based on uniform neighborhoods with radiii of 0.004 degrees (centered around each instance).

To download this notebook click here. Similar plots of the degree distribution for the City of Chicago (for a 10-day period) are shown below. The notebook can be downloaded here.
The network below is a visualization of the graph using JavaScript. Click on “next” to see how it evolves.