Crime hotspots in Chicago
The left plot below illustrates the total amount of crime instances that occurred in the city of Chicago during a January 1st, 2013. The right plot shows the location of police cameras.
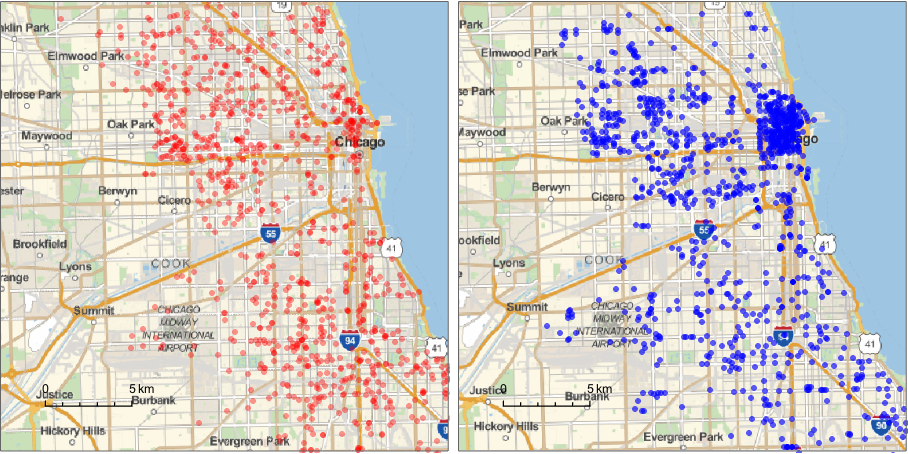
This
notebook illustrates the areas in Chicago that had a high crime rate during the first semester of 2013. Each time step captures the distribution of all types of crimes within the past 7 days. Visualizing the evolution of crime shows that hotspots are defined within specific areas (left plot). The right plot represents the hotspots generated by location of the police cameras. Hotspots are created using optimal bandwidth for standard normal data.
Arrest patterns are shown in the video below. The left plot illustrates the distribution of crimes that lead an arrest; the right plot shows again the location of police cameras.